
Soybean Market Analysis with Video
Trent Klarenbach of Klarenbach Research discusses the state of the soybean market as of December 11, 2024 analying the weekly and daily trends with a focus on key moving averages and levels of support and resistance.
He notes the importance of the $1,000 level and anticipates sideways consolidation.
Klarenbach emphasizes that despite a currently bearish outlook with prices below declining 50-day and 200-day moving averages, surpassing certain price thresholds could shift his perspective to a more bullish stance.
Click here to watch our video analysis:
Video Timestamps
00:00 Introduction and Market Sentiment
00:18 Analyzing the Weekly Soybean Futures Chart
01:23 Daily Chart Insights and Moving Averages
02:16 Volume Weighted Average Price Analysis
03:28 Conclusion and Market Outlook
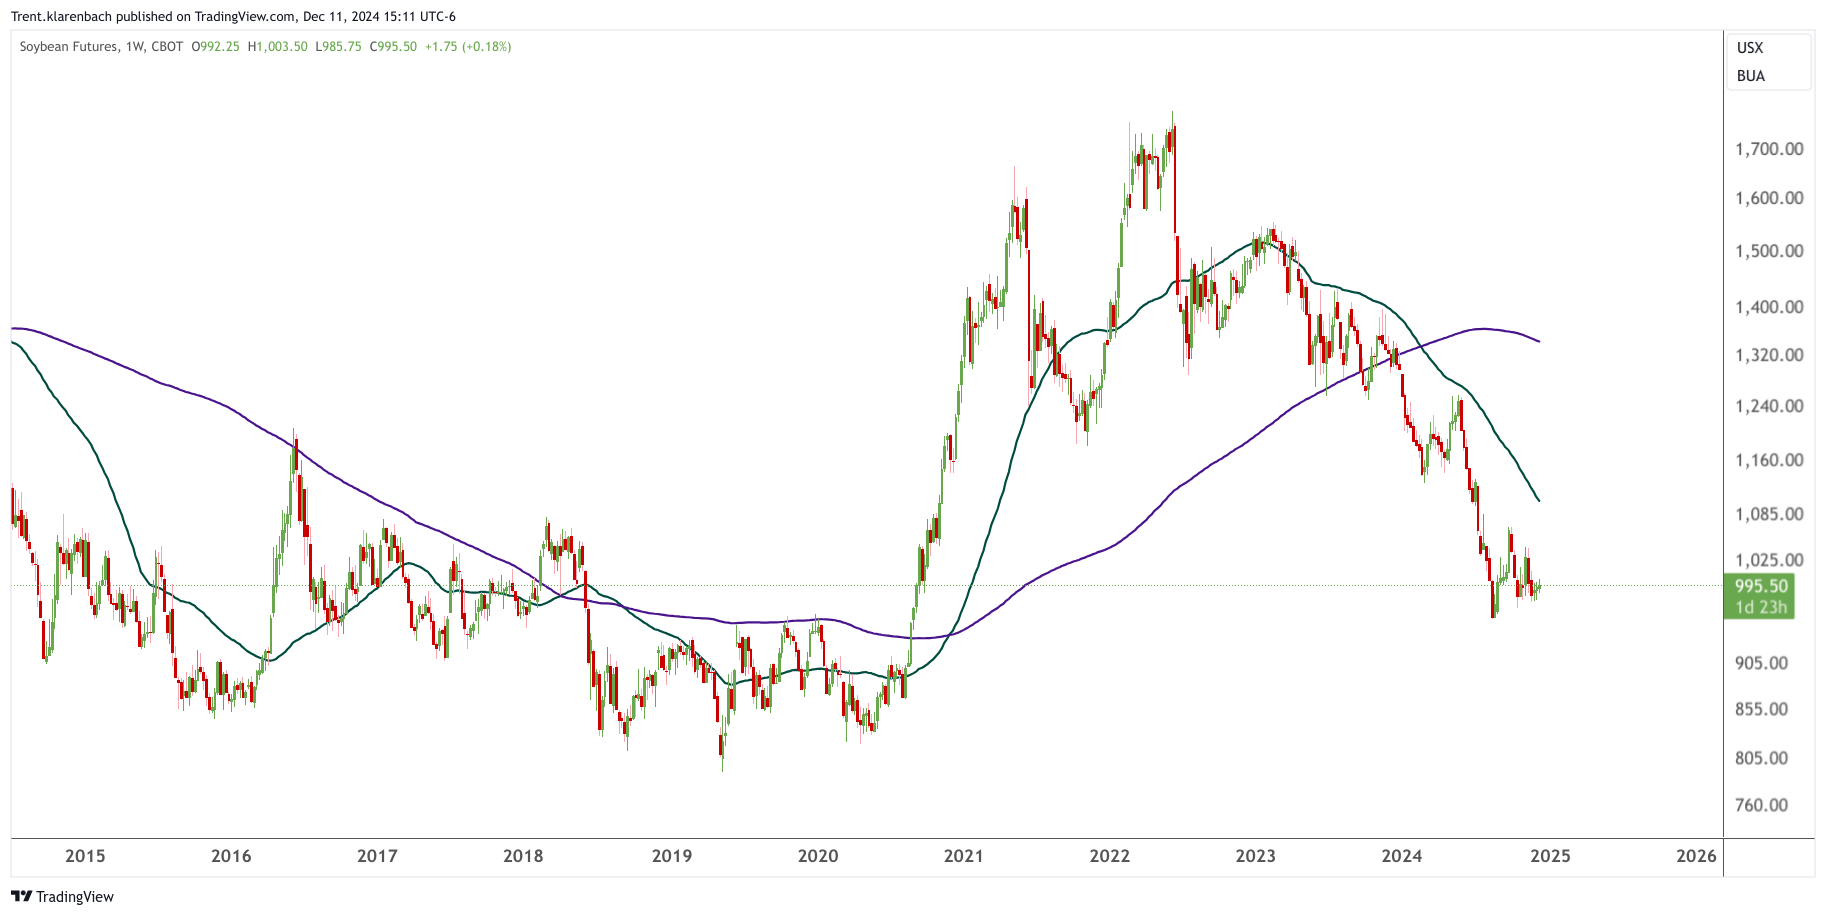
Weekly Nearby Chart
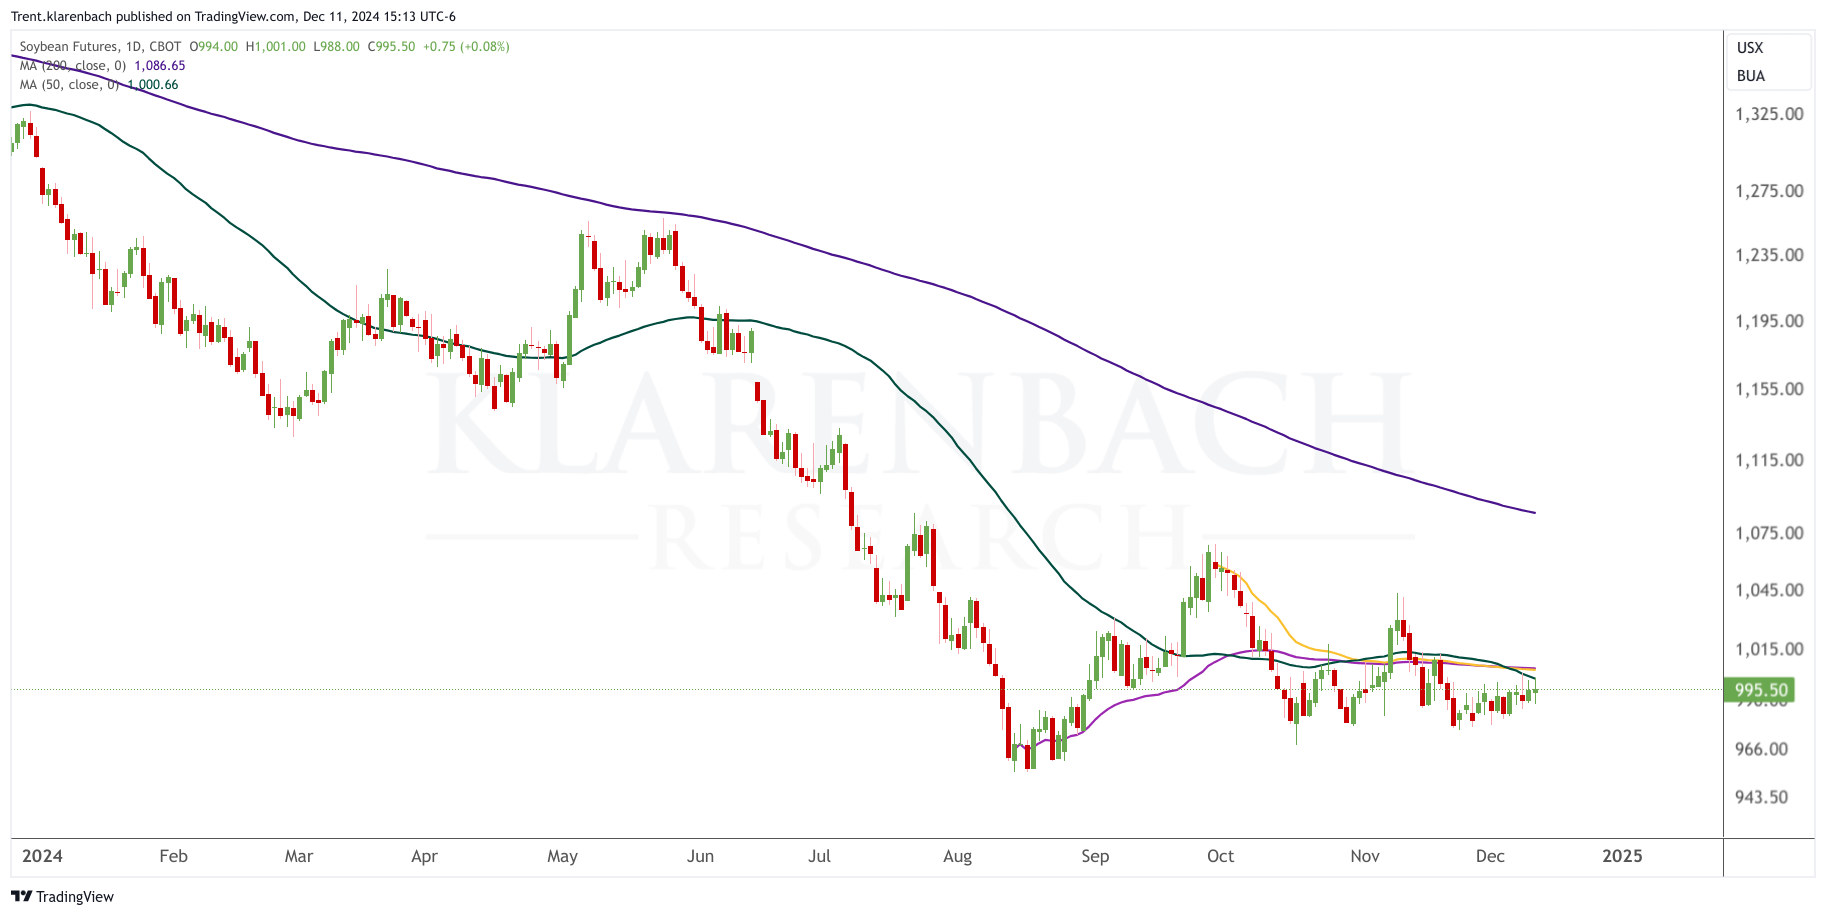
Daily Nearby Chart
Current Price
Soybean futures are trading around $995.50, testing resistance levels.
Key Technical Levels
Support: $950 to $980 range.
Resistance: $1,000 level and the declining 50-day moving average.
Moving Averages
50-Week and 200-Week: Price remains below both averages, confirming a downtrend.
50-Day Acts as short-term resistance, reflecting bearish sentiment.
Anchored Volume Weighted Average Price (AVWAP)
AWAPs from August 14 (purple) and September 30 (yellow) align just above $1,000.
Outlook
Short-term bullish if price closes above $1,000 and AVWAPs.
Below this level, the market remains bearish as contract holders are likely to sell.
Sentiment

Trent Klarenbach, BSA AgEc, publishes the Klarenbach Grain Report and the Klarenbach Special Crops Report.
Klarenbach Research
Sign up below for a FREE trial of our newsletters

